Acknowledgements 3
1. Introduction 4
2. Overview: A Multimedia Integration
Approach 5
3.
Multimedia Sensors 7
3.1 The LDV
sensor 7
3.2. Infrared
camera 9
3.3. PTZ
camera 10
4. Laser Doppler Vibrometer: Principle and
Applications 11
5. LDV Audio Signal Enhancement 14
5.1. The
Gaussian bandpass filter 15
5.2. Volume
selection and adaptation 19
6.
Experiment Designs and Analysis 21
6.1. Real
data collections 21
6.2.1.
Experiments on long range LDV listening 22
6.2.2.
Experiments on listening through walls/doors/windows 23
6.2.3. Experiments
on talking inside cars 24
6.2.4.
Experiments on types of surfaces 26
6.2.5.
Experiments on surface directions 27
6.2. LDV
performance analysis 28
7. Discussions on Sensor Improvements and
System Integration 32
7.1. Further
research issues in LDV acoustic detection 33
7.2.
Multimodal integration and intelligent targeting and focusing 36
8. Conclusions 36
9. References 37
We are grateful to Lt. Jonathan Lee and Mr. Robert Lee at
the Air Force Research Laboratory (AFRL) for their guidance and valuable
discussions on many technical issues on laser Doppler vibrometers during the
course of this work. Prof. George Wolberg at the City College has been involved
in a collaboration effort with the PI on the multimodal sensor integration for
human signature detection, and has also provided many insightful suggestions
and discussions. Prof. Ning Xiang at Rensselaer Polytechnic Institute (RPI) has
provided his consulting services on laser Doppler vibrometers that have led us
to a better understanding of this new type of sensor. Prof. Esther Levin, with
her expertise in speech technology, has provided valuable discussions on speech
signal processing. We also thank Mr. Robert T. Hill at the City College for
proofreading the document and for providing some valuable comments and
suggestions.
This material is based on research sponsored by the Air
Force Research Laboratory under agreement number F33615-03-1-6383. The U.S.
Government is authorized to reproduce and distribute reprints for Governmental
purposes notwithstanding any copyright notation thereon. However, the views and
conclusions contained herein are those of the authors and should not be
interpreted as necessarily representing the official policies or endorsements,
either expressed or implied, of the Air Force Research Laboratory or the U.S.
Government.
Recent improvements in laser vibrometry [1-6] and day/night
IR imaging technology [15] have created the opportunity to create a long-range
multimedia surveillance system. Such a
system would have day and night operation.
The IR video system would provide the video surveillance while allowing
the operator to select the best target for picking up audio detectable by the
laser vibrometer. This multimedia capability would greatly improve security
force performance through clandestine listening of targets that are probing or
penetrating a perimeter defense. The targets may be aware that they are
observed but most likely would not infer that they could be heard. This system
could also provide the feeds for advanced face and voice recognition systems.
Laser Doppler vibrometers (LDV) such as those manufactured
by Polytec™ [2] and B&K Ometron [3] can effectively detect vibration within
two hundred meters with a sensitivity on the order of 1µm/s. These instruments
are designed for use in laboratories (0-5 m working distance) and field work
(5-200 m) [2-7]. For example, these instruments have been used to measure the
vibrations of civil structures like high-rise buildings, bridges, towers, etc.
at distances of up to 200m. However, for distances above 200 meters, it will be
necessary to treat the target surface with retro-reflective tape or paint to
ensure sufficient retro-reflectivity. At distances beyond 200m and under field
conditions, the outgoing and reflected beam will pass through medium with
different temperatures and thus different reflective coefficients. Another
difficulty is that such an instrument uses a front lens to focus the laser beam
on the target surface in order to minimize the size of the measuring point. At
200m the spot size is 12mm and very weak. At 1,000m the spot diameter would be
63mm and extremely weak. At a distance above 200 m, the speckle pattern of the
laser beam induces noise and signal dropout will be substantial [8]. Finally,
the visible laser beam is good for a human to select a target, but it is not
desirable for a clandestine surveillance application.
The overall goal of this project is on an advanced
multimedia interface for human effectiveness in using the state-of-the-art
sensing technologies for perimeter surveillance. We believe that in the
foreseeable future of these technologies, human involvement in all the three
stages – sensors, alarm, and response - is still vital for a successful surveillance
system. Meanwhile, we fully realize
that the capabilities of sensors - infrared (IR) cameras, visible (EO) cameras,
and the laser vibrometers (LDVs) in our study - are critical to surveillance
tasks. IR and EO cameras have been widely used in human and vehicle detection
in traffic and surveillance applications. However, literature on remote
acoustic detection using LDVs is rare. Therefore, in this one year project we
have mainly focused on the experimental study of LDV-based voice detection, and
this will be the main focus of this report.
We have also set up a system with all
three types of sensors for performing integration of multimedia sensors
in human signature detection. This report also briefly discusses how we can use
IR/EO imaging for target selection and localization for LDV listening.
This report is organized as follows. First, we give an
overall picture of our technical approach:
the human-centered technology paradigm for the integration of laser
Doppler vibrometry and IR imaging for multimedia surveillance display. The
basic idea is to provide an advanced virtualized-reality based interface of the
site (e.g., air base) to give the operator the best cognitive understanding of
the environment, the sensors, and the events. One of the important issues is
how to use IR imaging to help the laser Doppler vibrometer to select the
appropriate targets.
Then, we discuss various aspects of LDVs for voice
detection: basic principles and problems, signal enhancement algorithms, and
experimental designs. We focus on the study of the humancentered technology for
LDV sensor information enhancement and clandestine listening. We
investigate the performance of the laser Doppler vibrometer on two types of
targets: fixed facilities in the
environment that vibrate with humans and /or vehicles nearby, and the human
subjects themselves. We have designed a graphic human computer interface for
signal analysis, signal filtering, and signal synthesis. The graphic interface
helps a user to understand the relation between the signals and noises in term
of magnitudes and frequencies, and by signal synthesis (i.e. speech synthesis
from the filtered laser Doppler vibrometry signals), the user can adaptively
pick up the useful signals.
Speech enhancement algorithms are applied to improve
the performance of recognizing a noisy voice detected by the LDV system. The
detected speech signal may be corrupted by more than one noise source, such as
laser photon noises, target movements, and background acoustic noises (wind, engine
sound, etc.). Many speech enhancement algorithms have been proposed [9-12], but
they have been mainly used for improving the performance of speech
communication systems in noisy environments. Acoustic signals captured by laser
vibrometers need special treatment.
The laser Doppler vibrometer strongly depends the
reflectance properties of the surfaces of the target. Important issues like
target surface properties, size and shape, distance from the sensors, sensor
installation, and calibration strategy are studied through several sets of
indoor and outdoor experiments. By doing this study, we have gained a better
understanding of the LDV performance, which could guide us for improving the
LDV sensors. We provide a brief discussion on some future work in LDV sensor
improvements and multimedia human signature detections.
We envision that the integration of the IR imaging and laser
Doppler vibrometry will provide a multimedia display to the user with spatial
coherent environment, enhanced video and audio presentation, and rapid target
localization capabilities via the technologies of augmented reality,
video-audio registration, information filtering / enhancement, and automatic
target detection / listening. Ultimately,
this goal could be achieved for kilometer long-range surveillance. In this
one-year project, this research provides a feasibility study of multimedia
integration and visualization solutions with the state-of-the-art sensors.
There are three main components in our approach of
multimedia human signature detection (Figure 1, Figure 2): the IR/EO imaging
video surveillance component, the LDV audio surveillance component, and the
human-computer interaction components. Both the IR/EO and LDV sensing components
can support day and night operation even though it will be better to use a
standard EO camera (coupled with the IR camera) to perform the surveillance
task during daytime. The overall approach is the integration of the IR/EO
imaging and LDV audio detection for a long-range surveillance task. The
integration has the following three steps.
Step 1. Target detection, tracking, and selection via the
IR/EO imaging module. The targets of interest could be humans or vehicles
(driven by humans). This will be performed by motion detection and human/
vehicle segmentation methods.
Figure 1. System components of a multimodal human signature
detection system.
Step 2. Audio targeting and detection by the LDV audio
module. The audio signals could be human voices or vehicle engine sounds.
We mainly consider the human voice detection. The main issue is to select the
LDV targeting points provided by the IR/EO imaging module to detect the
vibration caused by human voices.
Step3. Face/vehicle shot of best view capture by the
feedback from audio detection. By using the audio feedback, the IR/EO
imaging module can verify the existence of humans and capture the best face
shots for face recognition. Together with the voice recognition module, the
surveillance system could further perform human identification and event
understanding.
An important concept is to design a human-computer interface
for the human-centered multimedia surveillance. Human involvement in all the
three stages – sensors, alarm, and response –
is vital for a successful surveillance system. Figure 2 shows the
human-computer interaction (HCI) synopsis for human-in-the-loop surveillance
operation with augmented reality (AR) visualization, target selection, signal
extraction and enhancement, and human identification.
Figure 2. System Diagram. The Human-Computer Interaction (HCI)
is important for sensor modeling/registration, video/audio detection, and
recognition.
For enabling the study of the multimedia sensor
integration for human signature detection, we have acquired the following
sensors: a Laser Doppler Vibrometer (LDV) OFV-505 from Polytec, a ThermoVision
A40M infrared camera from FLIR, and a Canon color/near IR pan/tilt/zoom (PTZ)
camera. The FLIR ThermoVision A40M IR camera and the Canon PTZ camera VC-C50i were purchased under the
funding this project, and the Polytec LDV was purchased with a matching funding
through a CUNY Equipment Competition Award. We will briefly list the main
characteristics of each of them in the following paragraphs.
The Laser Doppler Vibrometer from Polytec [2] includes a
controller OFV-5000 with a digital velocity decode card VD-6 and a sensor head
OFV-505 (Figure 3). We also acquired a telescope VIB-A-P05 for
accurate targeting at large distances.
The sensor head uses a particular helium neon red
laser with wavelength of 633 nm and is equipped with a super long-range lens.
It sends the interferometry signals to the controller, which is connected to
the computer via an RS-232 port. The controller box includes a velocity decoder
VD-06, which processes signals received from the sensor head. There are a
number of output signal formats from the controller, including an S/P-DIF output
and digital and analogue velocity signal outputs.
Figure 3 The Polytec™ LDV (a)
Controller OFV-5000 (b) Sensor head OFV-505 (c) Telescope VIB-A-P05
To receive and to process the signal from the
controller, we use a low-cost Audigy2 ZS audio card with built-in S/P-DIF I/O
interface on the console of the computer. This audio card can receive the
digital signals from the controller and play them back through the audio
outputs on the console machine. It can also save the received signals as audio
files, e.g., in MP3 or WAV format. The main features of the LDV sensor and the
accessories are listed as follows:
n Sensor Head OFV-505
n HeNe (Helium-Neon) laser, l=632.8 nm, power <1 mW
n OFV-SLR lens (f=30mm) 1.8 m – 200+ m, automatic focus
n “Any” surface
n Controller OFV-5000
n Low pass (5, 20,100 kHz), high pass (100Hz), tracking filters
n RS-232 interface for computer control
n Velocity Decoder VD-06
n Ranges: 1, 2, 10 and 50 mm/s/V
n Resolution 0.02 mm/s
under 1mm/s/V range (2mv/20V)
n 350 kHz bandwidth analog output
n 24 bit, 96 kHz max. digital output on S/P-DIF interface
n Telescope VIB-A-P05
n +/-1° vertical tilt and +/-1.5° horizontal tilt
n HeNe interference filter gives improved visibility
We also developed a software system, called
LDVProject (LDVProject.jar), to configure the
controller and process the received LDV digital signals for audio play (Figure
4). This system communicates with the controller via the RS-232 interface by
sending commands to the controller to change the device parameters and to
monitor the status of the device. This system also has integrated some LDV
signal processing and enhancement components, which will be described in
Chapter 4.
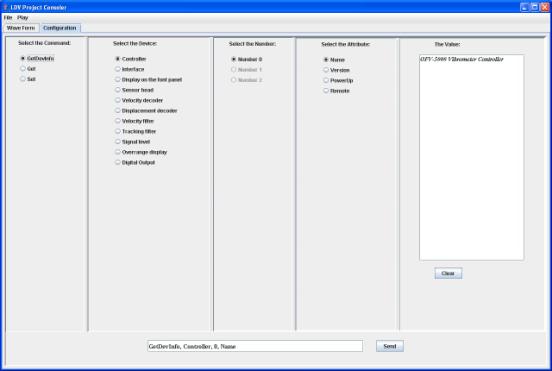
Figure 4. LDV control interface
 The FLIR ThermoVision A40M IR camera has the
following features that make it suitable for human and vehicle detection:
The FLIR ThermoVision A40M IR camera has the
following features that make it suitable for human and vehicle detection:
n Temp Range of -20° to 500°C, accuracy (% of reading) ± 2°C or ± 2%
n 320 x 240 Focal Plane Array with Uncooled Microbolometer Detector, spectral range 7.5
to 13 µm
n 24° FOV
Lens, spatial resolution 1.3 mrad and with built-in focus motor
n Firewire Output - IEEE-1394 8/16-bit monochrome & 8-bit color
n Video output - RS170 EIA/NTSC or CCIR/PAL composite video for monitoring on
a TV screen
n Keyboard Interface for easy on-site control of the camera
n ThermoVision Systems Developers Kit (C++) for software
development
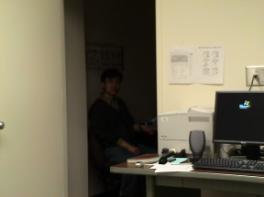
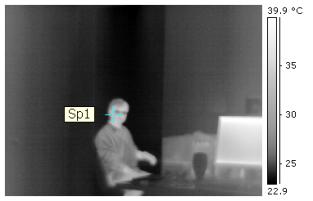
Figure 5(1). A person sitting in a dark room can be clearly
seen in the IR image, and the temperature can be accurately measured. The
reading of the temperature at the cross (Sp1) on the face is 33.1oC.
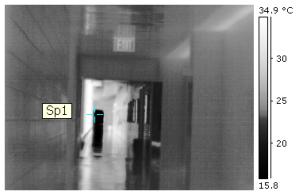
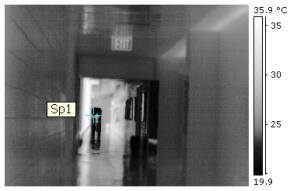
Figure 5(2). Two IR images before and after a person standing
at about 200 feet. The reading of the temperature at the cross (Sp1) changes
from 11oC to 27 oC. The corresponding color images with
the person in the scene are shown in Figure 6.
Figure 5(1) shows an example where a person sitting
in a dark room can be clearly detected by the FILR ThermoVision far-infrared
camera. Furthermore, the accurate temperature measurements also provide
important information for discriminating human bodies from other hot/warm
objects. After the successful detection of humans, objects, such as the doors
or walls in this example, can be searched in the environment whose vibration
with audio waves could reveal what the persons might be speaking. Note that the FILR ThermoVision IR camera is
a far-infrared thermal camera. It does not need to have active IR illumination,
and it is suitable for detecting humans and vehicles at a distance (Figure
5(2)).
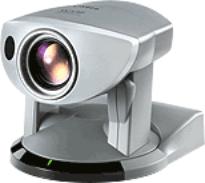
The state-of-the-art, computer controllable
pan/tilt/zoom (PTZ) camera is also ideal for human and other target detection
at a large distance. The Canon PTZ camera we acquired has the following
properties:
n 26X optical zoom lens & 12X digital zoom
n 1/4" 340,000 pixel CCD
 n Pan:
+/-100º, Tilt: +90/-30º
n Pan:
+/-100º, Tilt: +90/-30º
n Minimum Subject Illumination 1 Lux
(1/30 second
shutter speed)
n Motorized infrared (IR) cut filter on/off
n Built-in IR light (effective up to 9 feet).
n BNC video output
n RS-232 computer control interface
n Compact and lightweight at only 14.3 oz
Figure 6 shows two images of the same scene with two
different camera zoom factors. The built-in IR light will not work for long
distances. However, since the camera can sense near-IR waves, a LDV with near
IR laser can be seen by this kind of camera for IR laser based LDV targeting.
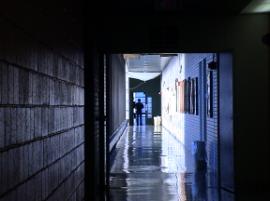
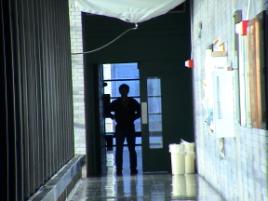
Figure 6. Two images of a person at a distance of about 200
feet, captured by changing the zoom factors of the PTZ camera.
Laser Doppler vibrometers (LDVs) work according to the
principles of laser interferometry. Measurements are made at the point where
the laser beam strikes the structure under vibration. In the Heterodyning
interferometer (Figure 7), a coherent laser beam is divided into object and
reference beams by a beam splitter BS1. The object beam strikes a point on the
moving (vibrating) object and light reflected from that point travels back to
beam splitter BS2 and mixes (interferes) with the reference beam at beam
splitter BS3. If the object is moving (vibrating), this mixing process produces
an intensity fluctuation in the light.
Whenever the object has moved by half the wavelength, l/2, which is 0.3169 mm (or 12.46 micro inches) in the case of HeNe laser, the
intensity has gone through a complete dark-bright-dark cycle. A detector
converts this signal to a voltage fluctuation. The Doppler frequency fD
of this sinusoidal cycle is proportional to the velocity v of the object
according to the formula
 (1)
(1)
Instead of detecting the Doppler frequency, the velocity is
directly obtained by a digital quadrature demodulation method [1, 2]. The Bragg
cell, which is an acousto-optic modulator to shift the light frequency by 40
MHz, is used for identifying the sign of the velocity.
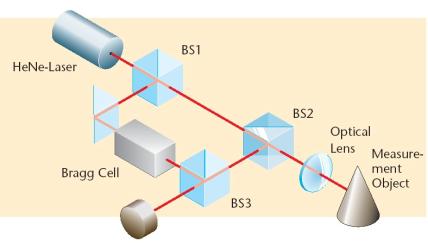
Figure 7 .The modules of the Laser Doppler Vibrometer (LDV)
Most objects vibrate while wave energy (including
voice waves) is applied on them. Though the vibration caused by the voice
energy is very small compared with other vibration, this tiny vibration can be
detected by the LDV. Voice frequency f ranges from about 300 Hz to
3000Hz. Velocity demodulation is better for detecting vibration with higher
frequencies because of the following relation of velocity, frequency, and
magnitude of the vibration:
v
= 2p f m (2)
Note that the velocity v will be large with a
large frequency f, even under a small magnitude m. The Polytec
LDV sensor OFV-505 and the controller OFV-5000 can be configured to detect
vibrations under several different velocity ranges: 1 mm/s/V, 2 mm/s/V, 10 mm/s/V, and 50 mm/s/V, where V stands for
velocity. For voice vibration, we usually use the 1mm/s/V velocity range. The
best resolution is 0.02 mm/s under 1mm/s/V range, according to the manufacture’s
specification (with retro-tape treatment). Without retro-tape treatment, the
LDV still has a sensitivity on the order of 1 mm/s. This indicates that the LDV can detect
vibration (due to voice waves) at a magnitude as low as m = v/ 2p f = 1 /(2*3.14*300)
= 0.5 mm. Note that voice waves are in a relative low
frequency range. The Polytec OFV-505 LDV sensor that we have is capable of
detection vibration with a much higher frequency (up to 350K Hz).
There are two important issues to consider in order
to use an LDV to detect the vibration of a target caused by human voices.
First, the target vibrates with the voices. Second, points on the surface of
the target where the laser beam hits reflect the laser beam back to the LDV. We
call such points LDV targeting points, or simply LDV points.
Therefore, the LDV points selected for audio detection could be the following
three types of targets (Figure 8).
Figure 8. Target
selection and multimedia display. The laser Doppler vibrometer (LDV) can
measure audio signals from tiny vibrations of the LDV points (indicated by the
beams and the red dots onto the objects in the figure) that couple with the
audio sources
(1) Points on a
human body. For example, the throat
of a human will be one of the most obvious parts where the vibration with the
speech could be detected by the LDV. However, we have found that it is very
challenging since it is “uncooperative”: (a) it is not easyily targeted,
especially when the human is moving; (b) it does not have a good reflective
surface for the laser beam, and therefore a retro-reflective tape has to be
used; (c) the vibration of the throat only includes the low frequency parts of
the voice. For these reasons, our experiments will mainly focus on the
remaining two types of targets.
(2) Points on a vehicle with humans within. Human
voice signals vibrate the body of a vehicle, which could be readily detected by
the LDV. Even if the engine is on and the volume of the speech is low (e.g., in
cases of whispering), we could still extract the human voice by signal
decomposition since the human voice and engine noise have different frequency
ranges. However, even if the vehicle is
stationary we have found that the body of the vehicle basically does not
reflect the HeNe laser suitably for our purposes without applying
retro-reflective tape. With retro-tape, the signal returns with LDV are
excellent when the targets (cars) are at various distances (10 to 50 meters in
our experiments) and also with a large range of incident angles of the laser
beam. It is even more challenging to detect the voice when the vehicle is
moving.
(3) Points in the environment. For perimeter
surveillance, we can use existing facilities or install special facilities for
human audio signal detection.
Facilities like walls, pillars, lamp posts, large bulletin boards, and
traffic signs vibrate very well with human voices, particularly during the
relative silence of night. Note that a
LDV has a sensitivity on the order of 1 mm/s,
and can therefore pick up very small vibrations. We have found that most
objects vibrate with voices, and many types of surfaces reflect the LDV laser
beam within some distance (about 10 meters). Response is even better if we can
paint or paste certain points of the facilities with retro-reflective tapes or
paints; operating distances can increase to 300 meters (1000 feet) or more.
Before we describe our experiment designs and data
collection, we will first introduce our algorithms for LDV voice signal
enhancement since we will need to analyze and present the results of the
collected data using the designed algorithms.
For the human voice, the frequency range is about
300 Hz to 3 KHz. However, the frequency response range of the LDV is much wider
than that. Even if we have used the on-board digital filters, we still get
signals that include troublesome large, slowly varying components corresponding
to the slow but significant background vibrations of the targets. The
magnitudes of the meaningful acoustic signals are relatively small, adding on
top of the low frequency vibration signals. This prevents the intelligibility
of the acoustic signals by human ears. On the other hand, the inherent “speckle
pattern” problem on a normal “rough” surface and the occlusion of the LDV laser
beam (by passing-by objects) introduce noises with large and high-frequency
components into the LDV measurements (Figure 9). This creates very high and
loud noise when we directly listen to the acoustic signal. Therefore, we have
applied a Gaussian bandpass filter to process the vibration signals captured by
the LDV. In addition, the volumes of the voice signals may change dramatically
with the changes of the vibration magnitudes of the target due to the changes
of speech loudness (shouting, normal speaking, whispering) and the distances of
the human speakers to the target. Therefore, we have also designed an adaptive
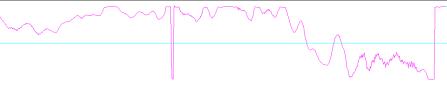
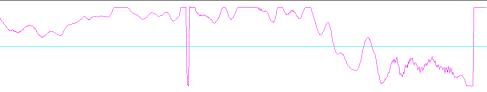
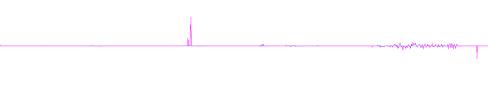
volume function to cope with this problem. Figure 9 shows two real examples of
these two types of problems.
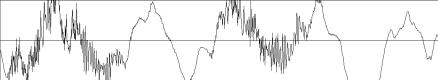
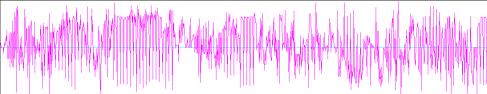
(a) “Hello…Hello” 
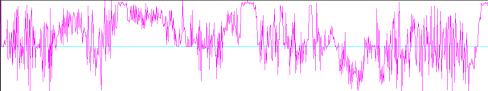
(b) “I am whispering…(high frequency noise)… OK … Hello (high
frequency noise)” 
Figure 9. Two real
examples of LDV acoustic signals with both low and high frequency noises. The
audio files can be played by clicking the corresponding speaker icons. (a)
“Hello…Hello” on top of a low frequency background component from the air
conditioning machine. (b) “I am
whispering…(high frequency noise)… OK … Hello (high frequency noise)” with both
low and high frequency noises. The volumes of voice changed from whispering to
normal to shouting. While the first audio clip is still audible, the second one
is almost impossible to hear without enhancement.
We can produce the Gaussian bandpass transfer
function by expressing it as the difference of two Gaussians of different
widths, as has been widely used in image processing [13], i.e.
 (3)
(3)
Figure 10 shows the function. The impulse response
of this filter is given by
 (4)
(4)
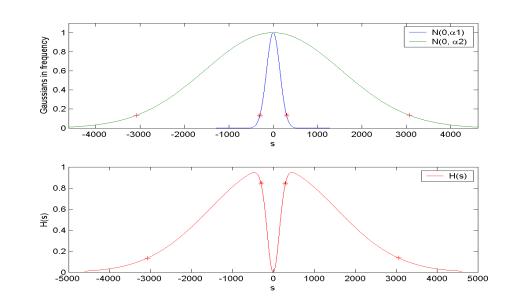
Figure 10. The Gaussian bandpass filter transfer function
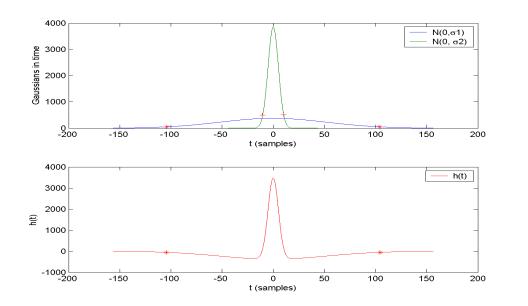
Figure 11. The Gaussian bandpass filter impulse response
Notice that the broader Gaussian in the frequency
domain (Figure 10) creates a narrower Gaussian in the time domain (Figure 11),
and vice versa. We want to reduce the signal magnitude outside the frequency
range of human voices, i.e., below s1= 300 Hz and above s2
= 3K Hz. The high frequency reduction is mainly controlled by the width of the
first (the broader) Gaussian function in Eq. (3), i.e., a2, and the low frequency reduction is mainly
controlled by the width of the second Gaussian function, i.e., a1. Since the Gaussian function drops significantly when |si|
> 2ai, (i=1, 2), as shown
by a pair of ‘*’s and a pair of ‘+’s in Figure 10, respectively, we obtain the
widths of the two Gaussian functions in the frequency domain as
 (5)
(5)
In practice, we process the waveform directly in the
time domain, i.e., by convolving the waveform with the impulse response in Eq.
(4). This leads to a real-time algorithm for LDV voice signal enhancement. For
doing this, we need to calculate the variances of the two Gaussian functions in
the time domain. Combining Eq. (4) and Eq. (5) we have
 (6)
(6)
For digital signals, we need to determine the size
of the convolution kernel. Since the narrower Gaussian (with width a1) in the frequency domain
creates a broader Gaussian (with width s1)
in the time domain, we use s1 to
estimate the appropriate window size of the convolution. Again, we truncate the
impulse function when we have t > 2s1.
Therefore, the size of the Gaussian bandpass filter is calculated as
 (7)
(7)
where m is the sampling rate of the digital signal.
Typically, we use m = 48 K samples/second with the S/P-DIF format. Therefore, the size of the window will be W1
= 210. The size of the convolution kernel is marked by a pair of ‘*’s in Figure
11.
As noted in [10], most speech enhancement systems
improve the quality of the signal (i.e. reduce the noise level) at the expense
of reducing its intelligibility. Listeners can usually extract more information
from the noisy signal than from the enhanced signal by carefully listening to
that signal, since by filtering, some of the useful acoustic signal components
are also reduced. We first look at the high frequency reduction issue. In some
cases, reducing frequency above s2= 3K Hz will obviously reduce the
level of the high frequency noise, particularly for some very short time noises
brought in by a passing vehicle or a person in front of the LDV, where very
high frequency “screaming” noise will be generated (e.g. Figure 9b). Without
high frequency reduction, listeners experience fatigue over extended listening
sessions, a fact that results in reduced intelligibility of the noisy
signal. This can be demonstrated by
listening to a pair corresponding audio clips before and after high-frequency
reduction in Figure 15. In some other cases, high frequency reduction will make
the speech “heavy”, and sometimes bring in some other high frequency noise due
to the digital processing of the filtering (e.g., truncation of the Gaussian
window). An example is shown in Figure 14.
Now let us look at the low-frequency reduction
problem. Different from the common speech communication systems, our speech
signals are captured by a vibrometer, which in many of the cases have
significantly low “signal-to-noise-ratio”, i.e. very high magnitudes of the
low-frequency background vibration “noises” due to wind, the engine of a
vehicle, or an air conditioning machine, and also relatively low magnitudes of
the vibration measurements due to the inherent qualities of speech (Figure
9). In some cases, it is not possible
for the listener to perceive the vibration signals as speech (Figure 9b).
However, in some of the cases where the reflection of the LDV laser beam is
perfect and the low frequency vibration magnitudes are low or the voice
components are comparable to the background vibration (Figure 9a), the
intelligibility will be better without low-frequency reduction, and the
computation in filtering will be much less expensive (as will be shown below).
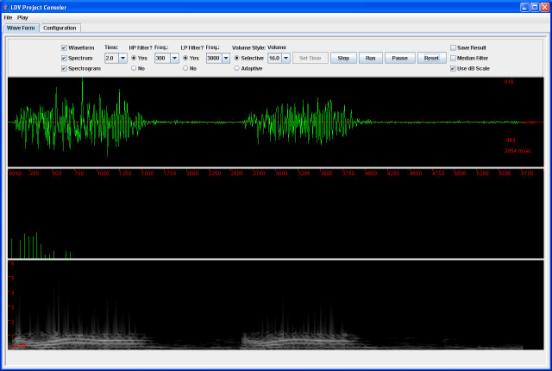
Figure 12. LDV voice signal processing interface.
Therefore, in our current implementation, the user
has the control over the high-frequency reduction and/or the low-frequency
reduction by enabling/disabling the low-pass (LP) filter and the high-pass (HP)
filter, and also by selecting an appropriate frequency range (Figure. 12). We
are also working on algorithms that can automatically analyze original LDV
signals and then determine what is the appropriate range of the band-pass
filter. In practice, with only one of them on we could simplify the
computation. Without high-frequency reduction, we have a2 approaching infinity, and therefore the narrower
Gaussian in the time domain narrows down to an impulse and the filter has the
form shown in Figure 13. In this case, the impulse response becomes
 (8)
(8)
The result of the processed signal is simply the
original signal subtracted by the result of the Gaussian low-pass filter, with
variance s1. However, the
window size in convolution is still W1 in Eq. (6), and therefore
there is no significant benefit in terms of computational cost.
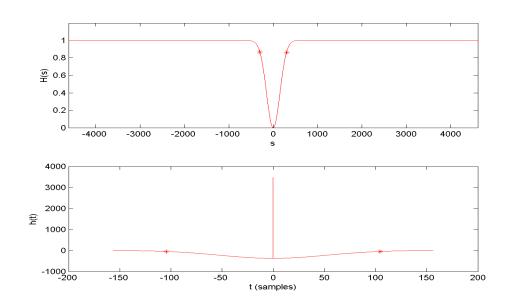
Figure 13. The Gaussian low-stop filter
On the other hand, without low-frequency reduction
the band-pass filter becomes a Gaussian low-pass (LP) filter with variance s2. In this case the window size in convolution becomes
 (9)
(9)
which is much narrower and more computationally
efficient. For example, when m = 48 K samples/second and s2 = 3K Hz,
we have W2 = 21. The size of the window is marked by a pair of ‘+’s
in Figure 11.
A real example of Gaussian bandpass filtering is
shown in Figure 14, with different combinations of the two filters
(low-reduction and high-reduction). The corresponding audio clips can be played
by following the links in the sub-captions.
(a) Original signal
( ) (b)
Low-reduction signal via HP filter (
) (b)
Low-reduction signal via HP filter ( )
)
(c) High-reduction
signal via LP filter ( ) (d) Band-pass signal (
 )
)
Figure 14. The waveform and the corresponding spectrograms of (a)
Original signal (no filter) and (b) Gaussian high-pass (i.e. low-reduction)
filter and (c) Gaussian low-pass (i.e. high-reduction) filter and (d) Gaussian
band-pass filter. In each picture, both the waveform and the corresponding
spectrogram are shown. The spectrograms are generated when the FFT window is
1024 samples, or 21.3 ms as the sampling rate is 48 K samples/second. We use s1
= 300 Hz for low-reduction and s2 = 3000 Hz for high-reduction in this example.
The useful original signal obtained from the S/P-DIF
output of the controller is a velocity signal. When treated as the voice
signal, the volume is too small to be heard by human ears. When volumes of the
voice signals change dramatically within an audio clip, a fixed volume increase
cannot lead to clearly audible playback. Therefore, we have designed an
adaptive volume algorithm. For each frame, for example of 1024 samples, the
volumes are scaled by the following equation:
 (10)
(10)
where  is the scale factor
of the volume,
is the scale factor
of the volume,  is the maximum constant value of the volume (defined as the largest
short integer, i.e., 32767), and
is the maximum constant value of the volume (defined as the largest
short integer, i.e., 32767), and  are sample data in one speech frame (e.g. n = 1024 samples).
The scaled sample data stream,
are sample data in one speech frame (e.g. n = 1024 samples).
The scaled sample data stream,  , will then be played via a speaker so that a suitable level
of voice will be heard.
, will then be played via a speaker so that a suitable level
of voice will be heard.
An alternative way of playing this original signal
is simply to multiply the sampled data by a constant scale value, e.g., 8 or
16. The advantage of this approach is that we can hear a smoother voice than
that of the adaptive method. However, the adaptive method will always give a
suitable volume for any kind of the sampled data stream. Actually, in our
software system, both methods are implemented, and the user can choose either
method on the fly. Figure 15 shows a real example of filtering and scaling. In
this example, the best performance of the filtering is obtained with only the
low-reduction filter (Figure 15e).
(a) Original
signal ( )
)
(b) ´1
after band-pass filtering ( )
)
(c) ´8
after band-pass filtering ( )
)
(d) adaptive
scaling after band-pass filtering ( )
)
(e) adaptive
scaling after low-reduction filtering ( )
)
Figure 15. The waveform of the original signal and the results
of fixed scaling and adaptive scaling, after using suitable filtering. The
short audio clip reads “I am whispering…(noise)… OK … Hello (noise)”, which was
captured by the LDV OFV-505 from a metal cake-box carried by a person at a
distance of about 30 meters from the LDV. The surface of the target was treated
by a piece of retro-tape. The complete audio clip can be found in the following
section in the distance experiment (Table 1 OA-30M and PA-30M).
In order to use a LDV to detect audio signals from a
target, the target needs to meet two conditions: reflection to HeNe laser and
vibration with voices. Due to the difficulty in detecting voice vibration
directly from the body of a human speaker, we mainly focus on the use of
targets in the environments nearby the human speaker. We have found that the
vibration of most objects in man-made environments caused by waves of voices
can be readily detected by the LDV. However, the LDV must get signal returns
from the laser reflection. The degrees of signal returns depend on the
following conditions:
(1) Surface
normal vs. laser beam direction;
(2) Color of the
surface with spectral response to 632.8 nm, and
(3) Roughness of
the surfaces – the inherent speckle pattern problem of the laser reflection
greatly affects the signal to noise ratio (SNR).
(4) The distance
from the sensor head to the target.
Retro-reflective traffic tapes or paints are a
perfect solution to the above reflection problems if the targets are
“cooperative”. That is to say, if the surfaces of targets can be treated by
such tapes or paints. The traffic retro-reflective tapes (retro-tapes) are
capable of diffuse reflection in that they reflect the laser beam back in all
directions within a rather large angular range. In the following, we will
present the experimental results first in real environments and then in somewhat
controlled environments.
We have performed experiments with the following settings:
types of surface, surface directions, long-range listening, through-wall
listening, and talking inside of cars. In all experiments, the LDV velocity
range is 1 mm/s/V, and a person’s speech describes the experiment
configurations. A walkie-talkie is used for remote communication only. With
each example, we provide links for both the original LDV audio clip and the
processed audio clip. The same configurations (band-pass 300 – 3000 Hz,
adaptive volume) are used in processing the data for all the experiments,
unless indicated. Each audio clip should tell you most of the information for
the experiment if it is intelligible. Typically, the duration of each clip is
about 1 to 3 minutes. Sometimes the signals start with a period of noises (no
speaking), but all of them should include large portions of meaningful voices.
Note that we only include original data and the corresponding processed data
with one fixed configuration of filtering. The original clips have very low
volume so you usually cannot hear anything meaningful; on the other hand, the
processed audio clips are not optimal at all for intelligibility. A java
program (LDVProject.jar)
is included with this report, which can be interactively tuned in real-time to
get the best intelligibility of the enhanced LDV audio signals. It is
recommended that the readers run the program, open an audio clip, and change
the filtering and volume configurations to both view the waveforms and to hear
the audio output.
Figure 16. Long range LDV listening experiment. A metal cake
box (left) is used, with a piece of 3M traffic retro-tape pasted. The laser
spot can be clearly seen.
We tested the long range LDV listening in an open space in
Amherst MA, with various distances from about 30 to 300 meters (100 ft to 1000
ft). A small metal cake box with retro-tape finish was fixed in front of the
speaker’s (Prof. Zhu’s) belly. The signal return of the LDV is insensitive to
the incident angles of the laser beam thanks to the retro-tape finish. Both normal speech volumes and whispers have
been successfully detected. The size of
the laser spot changed from less than 1 mm to about 5-10 mm when the range
changed from 30 to 300 meters. The noise levels also increased from 2 mV to 10
mV out of the total range of 20 V analog LDV signal. The movements of the body
during speaking may cause the laser beam to briefly stray off the tape, so
large noises could be heard in some places. Table 1 lists the original audio
clips and the processed audio clips at three different distances. The 260-meter
measurement was obtained when the target was behind trees/bushes. The changes
of volumes of the speaker’s speech could be read by listening to the speech.
With longer ranges, the laser is more difficult to localize and focus, and the
signal return becomes weaker. Therefore,
the noise levels become larger. Within 120 meters, the LDV voice is obviously
intelligible; at 260-meter distance, many parts of the speech could be
identified, even with some difficulty. For all the distances, the signal
processing plays a significant role in making the speech intelligible. Without
processing, the audio signal is buried in the low-frequency large-magnitude
vibration and high-frequency speckle noises. We also want to emphasize that
automatic targeting and intelligent refocusing is one of the important
technical issues that deserves attention for long range LDV listening since it
is extremely difficult to aim the laser beam at the target and keep it focused.
We believe that our multimedia integration approach provides a feasible way to
achieve this goal.
Table 1. Long range LDV listening via a cake box
We have also tested the long range LDV listening in a
corridor of a building at the City College (Figure 6) when Lt. Jonathan Lee at
AFRL visited us. Table 2 shows two sets of audio clips when Lt. Lee talked to
the same cake box nearby him, with and without retro-tape. The vibration
target (the cake box) was at a distance of about 100 meters (about 340 ft) from
the LDV sensor head. With the retro-tape, the speech is clearly intelligible.
The significance of this experiment is that without the retro-tape, the
speech is still intelligible from LDV detection of targets at a distance as far
as 100 meters. However, it is very noisy. Therefore with the state-of-the-art
sensor technology, we realize that more advanced signal enhancement techniques
need to be developed than the simple band-pass filtering and adaptive volume
scaling.
Table 2. Talking to a cake box 100 meters away, with and
without retro-tape
In the second set of experiments, we tested the LDV
listening through walls and windows (Figures 17 and 18). In the experiments of LDV listening through
walls, we tried several different cases: laser pointing to the wall and
pointing to the door from a distance of about 30 ft away, with and without
retro-tapes, vibrated by normal speech and whispering when the speaker was
walking around in a 15x15 square room, facing towards or away from the targets.
The original audio clips and the processed ones are listed in Table 3. We have
found that the speech is quite intelligible via the wall or the door if
retro-tape treatment is used, no matter whether the speaker talks in a normal
voice or a whisper, is facing the target or not, or is close or some distance
away. Without retro-tape, it is very hard to identify the speech, but we can definitely
tell the audio clips include a person’s speech.
Figure 17. Listening through walls – a person was speaking in a
room behind the door (right), while the LDV was listening in other room through
wall (left)
Table 3. Listening
through walls/ doors
|
Target/speech
/tape
|
Door/normal
w/ tape
|
Door/whisper
w/ tape
|
Wall/normal
w/ tape
|
Wall/normal
w/o tape
|
|
Original audio
|
OA-DNT

|
OA-DWT

|
OA_WNT

|
OA_WNN

|
|
Processed audio
|
PA-DNT

|
PA-DWT

|
PA_WNT

|
PA_WNN

|
|
Intelligibility
|
Good
|
Good
|
Fair to good
|
Okay to poor
|
In the experiments of LDV listening through windows,
we used the window frames as vibration targets while a person was speaking
outside the house (Figure 18, Table 4). The LDV was inside the second floor of
the house, several meters away from the window. The person spoke outside the
house, close to the window. Since the window frames are treated with paints,
the reflection is good, even though the signal return strength is less than
half of that with tape (see the bars in back of the LDV sensor Figure 18). We
have also tested listening via the window frame when the distance between the
sensor head and the target was more than 20 meters (or 64 ft) away. The LDV
voice detection almost has the same performance as this short-range example.
Figure 18. Listening through windows – a person was speaking
outside the house, close to a window, while the LDV was listening inside the
room via the window frame. Left: without retro-tape; right: with retro-tape.
The signal return strengths can be seen from the back of the sensor.
Table 4. Listening through windows
|
Target/Tape
|
Window frame/ No tape
|
Window frame/ retro-tape
|
|
Original audio
|
OA_WFN 
|
OA_WDT

|
|
Processed audio
|
PA_WFN

|
PA_WDT

|
|
Intelligibility
|
Good
|
Good
|
It is very interesting to consider whether LDV can
be used to detect voices from inside a vehicle in which intruders of a
perimeter may hide, making plans that they feel nobody will know. In such
cases, the car engine or music may be on and the persons may whisper quietly
inside the car. We simulated such situations by using several cars and minivans
at different distances, and we have tried to detect the vibration caused by
human speech inside the car via various parts of the car, (e.g. front door,
back truck, an object inside the car that can be seen through the windows of
the car). In contrast to our initial assumption, an automobile body does not
offer good retro-reflection of the LDV laser beam for effective listening.
Therefore, we have treated the
targeting points of the vehicles with retro-reflective tapes. Table 5 shows
some of the collected audio clips and the results after voice enhancement. We
have the following observations:
Figure 19. Talking inside cars
Table 5. Talking inside cars
|
Target
|
Front door
|
Front door
|
Front door
|
Balloon inside
|
|
Retro-tape
|
No
|
Yes
|
No
|
Yes
|
|
Distance
|
15-20 m
|
15-20 m
|
50 m
|
15-20 m
|
|
Audio source
|
music/voice
/engine
|
music/voice
/engine
|
music/voice
/engine
|
music/voice
/engine
|
|
Audio volume
|
varying
|
varying
|
varying
|
varying
|
|
Orig. Clip
|
OA_15N

|
OA-15T

|
OA_50N

|
OA_15B

|
|
Proc. Clip
|
PA_15N

|
PA-15T

|
PA_50N

|
PA_15B

|
|
Length
|
5 min
|
8 min
|
3.5 min
|
3.5 min
|
|
Intelligible
|
Music fine, Voice okay
|
Music fine,
Whisper voice good
|
Music fair,
Loud voice okay
|
Music fine
Voice good
|
(1). The speech vibration can be detected via any parts of
the car (front, side, back, inside).
(2). The speech can be distinguished with the engine and/or
music on.
(3). Whisper can also cause car body vibration that is
readily detectable by the LDV.
(4) With retro-tape treatment, the speech is clearly
intelligible; without retro-tape, human speech can be detected in short ranges,
within about 15 – 20 meters, but the SNR will be very low when the target is
far, e.g. above 50 meters. However, the human voice can always be identified at
such distances without retro-tape.
We have tested many different surfaces, both indoors and
outdoors, natural and man-made. In addition to car bodies, window frames,
walls, doors, and the metal cake box we have shown above, we have also tested
LDV measurements via traffic signs, building pillars, and lamp posts, with or
without using retro-tapes (Figure 20, Table 6). For example, a black building
pillar of a building in Figure 20 provides excellent LDV voice listening
capability without any retro-tape treatment. Traffic signs and a wooden shed
seem also to offer good media for carrying the voice signal from speakers to
the LDV sensors.
We have found that the LDV could obtain signal returns for
voice reading from most objects, without retro-tape treatment, if the distance
between the sensor head and the target is short: within 10 meters for most
objects, and within 100 meters for quite a few with good vibration and
reflection, such as metal cake box with paint finish, traffic signs, etc. With
retro-tape, the LDV works very well for almost all objects at large distances.
The largest distance we have tested is more than 300 meters.
Figure 20. Targets in the environment: building pillar, traffic
sign, wooden shed and lamp post.
Table 6. Types of targets (w/: with retro-tape; w/o: without
retro-tape)
In real applications, it is also important that the
LDV can get a signal return when the laser beam aims at a target at various
directions. In theory, the laser beam could be reflected back from the surface
of an object by fine adjusting the targeting location in such a way that the
surface normal on the scale of the wavelength of the laser beam is in the
direction of the laser beam. This can be achieved by maximum the signal return
of the LDV sensor when performing localization and focusing. However, in practice
this could be very problematic since small physical movements of either the
sensor or the targets may change the speckle patterns on rough surfaces [1].
This leads to very noisy signal, typically as white noise with large
magnitudes. A very practical solution is retro-reflective tape or paint surface
finishing, if allowed. Such retro-tapes (-paints) have the properties of
reflecting lights from a wide range of directions. Figure 21 and Table 7 show
an experiment of LDV voice detection through a normal mailbox with retro-tape
treatment. The voice signals are still intelligible even when the angle between
the surface normal and the laser beam is as large as 80 degrees.
Figure 21. Experiments on surface directions
Table 7. LDV listening vs. surface directions
In order to get a better understanding of the LDV
performance, we performed two sets of experiments in the lab with controlled
conditions, by controlling the voice sources and measuring several parameters
of the LDV signal returns.


Figure 22. Targets: whiteboard, wooden door, concrete wall and
a metal cake box
Table 8: LDV signal detection via different targets (Source
audio clip  /
/
 )
)
|
|
Cake Box
|
Wooden Door
|
Concrete Wall
|
Whiteboard
|
|
Retro Tape
|
 / /

|
 / /

|
 / /

|
 / /

|
|
No tape
|
 / /

|
 / /

|
 / /

|
 / /

|
*A pair of audio clips, original and processed by our software,
is listed in each case.
In the first set of experiments, we measured the
signal return strengths, vibration magnitudes and “signal to noise ratio (SNR)”
from various vibration targets, with and without retro-tapes. We used a
standard computer speaker to play a 6 second audio clip from a presentation by
Lt. Lee, and the sound vibrated objects in the lab. The objects we measured and
compared are a small metal cake box, a whiteboard, a wooden door, and a
concrete wall. The LDV laser beam was pointed to each target and an auto focus
was performed before each measurement. The distance of the targets to the LDV
was within several meters (about 10 ft). Table 8 lists one set of the audio
clips with the four types of targets, with and without retro-tape. A pair of
audio clips, original and processed, is listed for each collection.
The Polytec LDV provides a function to get signal
return strengths in the range of 0 to 512. Typically, the LDV audio signal
will not be intelligible if the strength is lower than 10. The signal magnitude
is measured as the average signal magnitude of the 6-second audio clip. This
tells us the vibration magnitudes of the object with the source sound. In order
to get a “signal to noise ratio (SNR)”, we also obtained LDV measurements under
the same conditions, but without playing the audio source. This means that the
vibration of the targets was caused only by background acoustic noises (e.g.,
air conditioning machine), physical noises (e.g. from movements of the sensor
head and the targets) and optical/electronic noises. Then, a pseudo SNR
could be obtained by taking the ratio between the average magnitudes of the LDV
signals with and without playing the source voice clip.
Table 9 lists the LDV signal return strengths when
the LDV audio clips in Table 8 were collected. It shows that the signal return
strength was full for all four objects we tested when the retro-tape was used.
This in fact indicates the reflection capability of the retro-tape. Without
retro-tape, the signal return strengths indicate the reflection properties of
the objects. The metal cake box (with paints), wooden door (with white paint),
and the plastic whiteboard all have almost half full signal return. The signal
return from the concrete wall (with white paint) is almost a quarter of the
full strength. Note that all the measurements were performed at a distance of
about 10 ft. Within that short distance, the voice signals without retro-tape
treatment almost have the same quality as those with retro-tape treatment.
Table 9: Signal return strengths of the objects from 10ft (The
full strength is 512)
|
|
Cake Box
|
Wooden Door
|
Concrete Wall
|
Whiteboard
|
|
Retro-Tape
|
512
|
512
|
512
|
512
|
|
No tape
|
200
|
230
|
120
|
250
|
Table 10 and Table 11 list the average signal
magnitudes from the four objects, with and without retro-tape, and with and
without playing original sound. In each case we performed the measurements
twice, so two average numbers appear in each table entry. Clearly, the signal
magnitudes with and without the meaningful sound source are comparable. This
indicates that the background noises cannot easily be removed. However, if the
magnitudes of the background noises mainly come from the low frequency
part (below 300 Hz) and the high
frequency part (above 3000 Hz), the
bandpass filter will reduce them.
Table 10: Magnitudes of LDV signals (under measurement range
1mm/s/V)
|
|
Cake Box
|
Wooden Door
|
Concrete Wall
|
Whiteboard
|
|
Retro-Tape
|
200/149
|
175/177
|
78/75
|
86/75
|
|
No tape
|
200/202
|
155/131
|
105/95
|
82/113
|
Table 11: Magnitudes of background noises (under measurement
range 1mm/s/V)
|
|
Cake Box
|
Wooden Door
|
Concrete Wall
|
Whiteboard
|
|
Retro-Tape
|
174/163
|
159/186
|
71/72
|
72/85
|
|
No tape
|
190/175
|
157/146
|
99/104
|
64/75
|
In the second set of experiments, we measured the above
properties of the LDV with the cake box we have used in the above experiments
at various distances in the corridor outside our lab (Figure 23). The distances
from the lab to one end of the corridor is 100 ft (about 30 m), and to the
other end of the corridor is 340 ft (about 100 m). In the first sub-set of the
distance experiments, we had measurements both with and without the retro-tape
on the cake box. In the second sub-set of the distance experiments, we only
obtained measurements with retro-tapes.
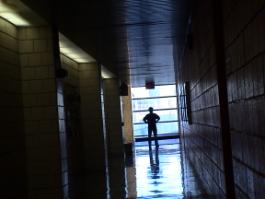
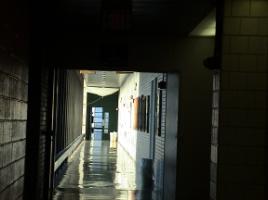
Figure 23. Distance experiments in the corridor. The target we
measured was the cake box. The distances from the sensor to one end of the
corridor is about 100 ft (left), and to the other end is about 340 ft (right).
In the first sub-set of experiments, a human speaker
read “LDV project experiment”. Table 12 lists the LDV signal return strengths
in several distance configurations. Note that without retro-tape, the signal
return strengths drop dramatically when the distance is above 50 ft, and at 100
ft the strength is below 10, which is the threshold for detecting meaningful
vibration signals by the LDV. Note that this does not mean we cannot obtain
meaningful LDV voice signal from a target above 100 ft without retro-tape
treatment. We have successfully obtained voice signals from the cake-box at 300
ft (Table 2). However, as we have noted, a fine and tedious targeting and
focusing of the laser beam needs to be performed so that the signal return
strength is above the threshold. As a comparison the signal return strengths
with retro-tape are also shown, which do not have significant decrease over
distances. The average magnitudes with and without the voice source are shown
in Table 13 and Table 14. Again, the magnitudes of the signals and the noises
are comparable. Note that at 100 ft the signal magnitudes are one order larger
than other measurements, which indicates that the signals captured by the LDV
are merely noises and therefore meaningless.
For reference, the links of the original audio clips (with voice source
played) are listed in Table 12, and the links of the high-reduction
processed audio clips are listed in Table 13. Readers may play and compare the
audio clips in Table 13 by clicking on the links, or may want to open the audio
clips listed in Table 12 by the LDV program LDVProject.jar
for an interactive audio/visual play.
Table 12: Signal return strengths of various distances (The
full strength is 512)
|
|
25ft
|
50ft
|
75ft
|
100ft
|
|
Retro-Tape
|
512 
|
512 
|
460 
|
400 
|
|
No tape
|
50-100 
|
14-30 
|
10-30 
|
10 
|
Table 13: Magnitudes of voices at various distances (1mm/s/v)
|
|
25ft
|
50ft
|
75ft
|
100ft
|
|
Retro-Tape
|
70/76 
|
92/89 
|
157/172 
|
162/175 
|
|
No tape
|
74/68 
|
148/87 
|
166/136 
|
1335/1828 
|
Table 14: Magnitudes of noises at various distances (1mm/s/v)
|
|
25ft
|
50ft
|
75ft
|
100ft
|
|
Retro-Tape
|
50/57
|
83/81
|
160/137
|
109/141
|
|
No tape
|
48/46
|
58/78
|
121/125
|
1604/1778
|
In the second sub-set of distance experiments, we
examined the longer range from 50 ft to 340 ft. We also roughly measured the
LDV laser spot size on the target. In all distances, retro-tape was used. Table
15 lists the measurements. The original audio clips are listed in the signal
strength column and the bandpass filtered and adaptive scaled audio clips are
listed in the “voice magnitude” column. We have the following observations
(1) The spot
size becomes significantly bigger at distances above 100 ft, and does not
increase significantly within 350 ft, thanks to the super long lens and the
auto focus function of the LDV sensor. We should note that even if the
measurements of the sizes are made roughly by human eyes, the size correlates
with the intelligibility of the audio signals. For example, since we have
better focus of the laser beam at 250 ft than at 200 ft, the voice at 250 ft is actually better.
(2) The signal
strength is almost full when the distance is below 100 ft, and is roughly half
full at the distance from 100 to 350 ft. However, the strength number is much
lower (around 50) when the laser beam is not perpendicularly directed to the
surface of the target and/or not focused well.
(3) The “SNR” is
still about 1:1, but the audio signals are intelligible at distances up to 340
ft.
Table 15: Results of longer distances experiments (LDV velocity
range 1mm/s/v)
|
Distance
|
Spot Size (mm)
|
Signal Strength (of 512)
(w/ orig. audio)
|
Noise Mags.
|
Voice Mags
(w/ proc. audio)
|
|
50ft
|
1
|
458 
|
174
|
185 
|
|
100ft
|
5-8
|
227 
|
159
|
156 
|
|
150ft
|
5-8
|
248 
|
119
|
165 
|
|
200ft
|
>10
|
45 
|
866
|
670 
|
|
250ft
|
< 10
|
290 
|
118
|
138 
|
|
300ft
|
10
|
277 
|
180
|
258 
|
|
340ft
|
10-15
|
65 
|
172
|
249 
|
Existing laser Doppler vibrometers are designed for use in
laboratories (0-5m working distance) and field work in relatively medium ranges
(5-200m). For distances above 100m it will be necessary to treat the target
surface with retro-reflective tape or paint to ensure sufficient
retro-reflectivity. Another difficulty is that such an instrument uses a front
lens to focus the laser beam on the target surface in order to minimize the
size of the measuring point. At 200m
the spot size is about 12mm and very
weak. At 1,000m the spot diameter would be 63mm and extremely weak.
In term of system integration, one of the interesting
research issues is human centered technology for sensor and target
allocation. The performance of the laser Doppler vibrometer strongly
depends on the reflectance properties of the surfaces of the targets. The AR
multimedia interface we have proposed provide a friendly platform to
investigate the performance of the laser Doppler vibrometers on two types of
targets – fixed facilities (cooperative
targets) in the environment that vibrate with the human and /or vehicle nearby,
and the moving subjects (uncooperative targets) themselves. Important issues
like automated target detection, localization and LDV focusing need to be
further studied. On the other hand, it
is extremely important to improve the laser Doppler vibrometer’s performance in
term of range and signal-noise ratio for long-range surveillance. In the
one-year study of this project, we have acquired the best LDV commercially
available, with super long-range lens and automatic focus. Then we have mainly
focused on the performance analysis with various possible targets (with and
without retro-tape treatment), and on signal enhancement algorithms. We realize
that sensor improvement is still needed for long-range voice detection.
In the following we will provide some initial thoughts along
the two lines for enabling long-range perimeter surveillance.
For the capability to measure vibration at large
distances, Scruby & Drain [1] made a very good description in the case of
ultrasonic measurements. The discussion is also valid for voice detection. In
application of laser interferometry, we are frequently concerned with surfaces
that are not optically finished or are irregular on the scale of the wavelength
of the light. Light scattered from different parts of the surface is not
phase-related and is consequently diffused over a wide angle. In a given
direction of scattering, the resultant may be considered as made up of
contributions from a large number of independent sources having the same
frequency but a random phase relation. In a slightly different direction, the
relative phases change and the resultant is different. This gives rise to an
irregular angular distribution of the intensity of the scattered light, a
“speckle pattern” characteristic of monochromatic illumination. The size of the
speckle is inversely proportional to the dimensions of the area
illuminated. Assuming that there are no
problems from atmosphere absorption or refractive index gradients, the
sensitivity of reference-beam interferometry is limited by the signal to noise
ratio
 (11)
(11)
assuming that the photon noise from the reference
beam is the dominant source of noise. Note that this is only a theoretical
bound for the LDV noise. In the above equation, Ws0 is the
mean light power per unit solid angle scattered from the whole illuminated spot
in the direction of the detector (i.e. average over the speckles), r0
is the radius of the spot size, and l
is the wavelength of the laser. Therefore the LDV’s sensitivity depends on the
laser power, the type of rough surface, and the focused spot size. We will
raise four questions around these issues and give some brief discussions.
1. Could LDV be used for any surfaces at a large
distance?
As we have found, almost all natural objects vibrate
with normal sound waves. However, surface reflectance is a big issue. The
relatively poor performance with a rough surface at a large distance is
basically due to the fact that only a small fraction of the scattered light
(approximately one speckle) can be used because of the coherence consideration.
This problem can be minimized by the use of a highly convergent illuminating
beam, thus reducing the spot size (the radius r0) and
consequently increasing the speckle size. This is probably the most practical
approach, which has been used by our Polytec super-long lens OFV-505 LDV sensor
head, and has been proved to be much more effective (up to 300 ft without
retro-tape, and up to 1000 ft with retro-tape) than all the other types of the
LDVs of the same company. We feel that increasing the focus over a longer range
(>1000 ft) still has potential, and truly intelligent targeting and
focusing is an important research issue, since at large distances it is
very hard for human eyes to see and focus the laser spot. We shall note here that this reduces the
depth of focus and increases the sensitivity to the sideways displacement of
the surface.
A more practical choice is to use surface treatment
with the stat-of-the-art LDV sensors. A useful surface finish for obtaining
good signal in LDV is retro-reflecting surface. With this the light is returned
to the sources independently of the orientation of the surface, thus maximizing
Ws0. Retro-reflecting surface finishes are available as
adhesive tapes and paints. The thickness of the finish is not a big issue for
the low frequency acoustic signals. However, in many military applications,
particularly in overseas airbase protection, applying retro-tape is not
practical. Spaying painting might be a better approach. Shooting small
retro-vibration bullets is another possible choice. With some smart way to
augment surface finishes, LDV remote non-contact listening will be a more
attractive alternative to microphone bugs since LDV obviates the need for a
remote power supply and wired communication channels.
2. What will be the technical and economic
challenges in changing the laser wavelength, e.g. from red to IR, or
ultraviolet?
The change of the red laser to invisible such as IR
and ultraviolet has several advantages. First, it satisfies the clandestine
requirement. Second, some surfaces
(e.g. windows) may have better reflection to wavelengths other than red. Third,
changing the wavelength may increase the sensitivity (Eq. (1), Eq. (11)). From Eq. (1), decreasing the wavelength will
increase the Doppler frequency shift, thus increasing the resolution of the
LDV. However, from Eq. (11) this could decrease the signal to noise ratio thus
decreasing the sensitivity. Therefore, further research needs to be performed
to find the best wavelength for LDV voice detection applications.
The current laser Doppler vibrometry technology is
shaped amongst other technologies, such as the advanced development of laser
itself along with necessary optical components and FM-demodulation components
that are available on the market. The laser used for Polytec OFV-505 is a
helium neon (HeNe) laser. This gas laser produces a visible red laser beam (l =
0.6328 µm), and it is an extremely low-noise light source and therefore suited
for vibration measurements. To the best of our knowledge, Doppler vibrometry
has not yet been commercially available for IR or ultraviolet. If there is a
driving force, we could find companies and/or institutions in IR or ultraviolet
laser communities who will be interested in developing specialized Doppler
vibrometry devices. From a technical standpoint of view, it is definitely a
feasible idea. However, it might be very costly if the infrastructure is not in
favor of developing.
3. How will the increase of laser power enhance
the range capability of the LDV?
Current laser power is limited by eye-safety issues
as dictated by laser industry standards. The Polytec OFV-505 uses a laser beam
with power less than 1mW. One may
increase the laser power to the upper limits of the standard up to 2 mW. This
increase (from 1 or 1.5 mW to 2 mW) will only slightly increase the signal
return strength and the sensitivity of the LDV (Eq. (11)), but these increases
will not be significant unless breaking of the eye-safe limit is allowed. The
wavelength and capability of longer-range focus (above 1000 ft) will bring more
benefit in the LDV sensitivity than only increasing the power. As we have
shown, the tiny vibration magnitude by voice waves is detected by the LDV in
terms of Doppler shifts. The resolution of the Doppler shifts that can be
measured is directly related to the wavelength of the laser light. With an
unreasonable Doppler shift resolution, no matter how many times of the laser
power may be increased (thus increasing the SNR) it will not increase the
performance, given that LDV can receive a reasonable reflected light. In
contrast, by carefully focusing the laser light at long range, one could realize
a drastic increase of performance quality.
4. Is it possible to have a handheld LDV for
acoustic detection, which means the sensor or targets might be moving? Will speckle pattern be a major problem
here?
Handheld LDV with high quality has been around on
the market for a while (such as Polytec PDV 100). However, the portable
versions of the LDVs can only be used for short range sensing and detection,
typically within a few meters and with retro-tape treatment. For long-range
applications, even if we can make the more advanced model such as Polytec
OFV-505 as portable as PDV-100 it will still be problematic since any movement
or jittering of LDV will be enhanced in a long distance, resulting in a faster
movement of the laser beam. This will drastically increase the negative effect
of speckle noise. In addition, the enhanced movement will cause apparent and
unwanted velocity mixing with measurements by the LDV. The speckle problem is inherent with laser
Doppler vibrometry technology, since the wavelength of the laser light is so
short that almost any practical surface under test can be considered as rough.
The roughness of a surface will cause constructive and destructive interference
of reflected light rays, which forms randomly distributed light-dark patterns:
speckle patterns [1]. The light sensor – a photo diode – cannot always get a continuous light
intensity. So, whether working in short
or long ranges, one has to deal with the speckle problem. For moving sensor and
long range targets, the speckle problem will become more serious since long
range measurement needs a increasing laser focus to reduce the spot size, but
as a side effect also increases the sensitivity to the sideways displacement of
the surface.
In conclusion, the LDV performance is dependent upon
all the fundamental properties of the laser: monochromaticity, coherence,
directionality, and high power density. Because of its ready availability
and excellent optical characteristics, notably monochromaticity and coherence,
the helium-neon laser has dominated much of the prior work in the field.
However, a LDV system based on 633 nm helium-neon laser is somewhat limited
with regard to maximum power (single mode stabilized < 3 mW, which controls
sensitivity – Eq. (11)). Therefore, other more powerful laser systems are
actively explored [1]. One choice is the argon ion laser, which can not only
deliver higher power (up to 20 W), but is also inherently more sensitive
because its shorter wavelength (488 nm or 514 nm), according to Eq. (1). The continuous wave (CW) Nd-YAG laser is
also available as a solid-state option for interferometry in infrared or
visible.
When using an LDV for voice detection, we need to find and
localize the target that vibrates with voice waves and reflects the laser beam
of the LDV, and then aim the laser beam of the LDV at the target. Multimodal integration of IR/EO imaging and
LDV listening provides a solution for this problem. Ultimately this will lead to
a fully automated system for clandestine listening for perimeter protection.
Even when the LDV is used by a soldier in the field, automatic target
detection, localization and LDV focusing will helps the solider to find and aim
the LDV at the target for voice detection.
We have found that it is extremely difficult for a human
operator to aim the laser beam of the LDV at a distant target and keep it
focused. In the current experiments, the human operator turns the LDV sensor
head in order to aim the laser beam at the target. The laser beam needs to be
re-focused when the distance of the target is changed. Otherwise the laser spot
is out of focus. As a consequence, it is very hard for the human to see the
laser spot at a distance above 10 meters, and it is impossible to detect
vibration when the laser spot is out of focus. In a typical distance
experiment, the target (or an “assistant” target), preferably with a
retro-reflective tape pasted, needs to be held by hand and to be moved
gradually from the sensor head to the designated distance, while trying to keep
the laser spot on it. About several meters, the LDV needs to be refocused to
make the laser spot clearly visible for human eyes. Even with the automatic
focus function of the Polytec OFV-505 sensor head, it usually takes more than
10 seconds for the LDV to search the full range of the focus parameter (0 –
3000) in order to bring the laser spot into focus. Therefore automatic
targeting and intelligent refocusing is one of the important technical challenges
that deserve attention for long-range LDV listening. Future research issues
include the following three aspects.
·
Target detection and localization via IR/EO imaging. Techniques for detecting
humans and their surroundings need to be developed for finding vibration
targets for LDV listening. We have set up an IR/EO imaging system with an IR
camera and a PTZ camera for this purpose.
·
Registration between the IR/EO imaging system and the LDV system. Two types of sensors need
to be precisely aligned so that we can point the laser beam of the LDV to the
target that the IR/EO imaging system has detected.
·
Automated targeting and focusing. Our current LDV system has real-time signal
return strength measurements as well as the real-time vibration signals. The
search range of the focus function can also be controlled by program.
Algorithms could be developed to perform real-time laser focus updating by
using the feedback of the LDV signal return strengths and the actual vibration
signals. We could also make micro movement of the LDV sensor head to track the
target to get the best signal return while performing automatic re-focusing.
The LDV is a non-contact, remote, and high-resolution (both
in spatially and temporally) voice detector. In this one-year project, we have
mainly focused on the experimental study on LDV-based voice detection. We also
briefly discuss how we can use IR/EO imaging for target selection and
localization for LDV listening. We have set up a system with three types of
sensors (IR cameras, PTZ color cameras and LDVs) for performing integration of
multimedia sensors in human signature detection. The basic idea is to provide
an advanced virtualized-reality based interface of the site (e.g., air base) to
give the operator the best cognitive understanding of the environment, the
sensors and the events.
We mainly discuss various aspects of LDVs for voice
detection – basic principles and problems, signal enhancement algorithms, and
experimental designs. We focus on the study of the human centered technology
for LDV sensor information enhancement and clandestine listening. We
have designed a graphic human computer interface for signal analysis, signal
filtering, and signal synthesis. The graphic interface helps a user to
understand the relation between the signals and noises in term of magnitudes
and frequencies, and by signal synthesis (i.e. speech synthesis from the
filtered laser Doppler vibrometry signals) the user can adaptively pick up the
useful signals.
We investigate the possibility and quality of voice
captured by LDV devices that point to the objects nearby the voice sources. We
have found that the vibration of the objects caused by the voice energy
reflects the voice itself. After the enhancement with Gaussian bandpass
filtering and adaptive volume scaling, the LDV voice signals are mostly
intelligible from targets without retro-reflective tapes at short distances
(<300 ft, or 100m). By using retro-reflective tapes, the distance could be
as far as 1000 ft (300 meters).
However, without retro-reflective tape treatment, the LDV
voice signals are very noisy from targets at medium and large distances.
Therefore, further LDV sensor improvement is required. With current
state-of-the-art sensor technology, we realize that more advanced signal
enhancement techniques need to be developed than the simple band-pass filtering
and adaptive volume scaling. For example, model-based voice signal enhancement
could be a solution in that background noises might be captured and analyzed,
and models could be developed from the resulting data.
We also want to emphasize that automatic targeting and
intelligent refocusing is one of the important technical issues that deserve
attention for long-range LDV listening, since it is extremely difficult to aim
a laser beam at a distant target and keep it focused. We believe that LDV voice
detection techniques combined with the IR/EO video processing techniques can
provide a more useful and powerful surveillance technology for both military
and civilian applications.
[1] C.B. Scruby and L. E. Drain, Laser Ultrasonics
Technologies and Applications, Bristol/Philadelphia/New York, Adam Hilger, 1990
[2] Polytec Laser Vibrometer,
http://www.polytec.com/
[3] Ometron Vibration Measurement Systems.
http://www.imageautomation.com/
[4] MetroLaser Laser Vibrometer,
http://www.metrolaserinc.com/vibrometer.htm
[5] B.J. Halkon, S.R. Frizzel and S.J. Rothberg,
"Vibration Measurements using Continuous Scanning Laser Vibrometry:
Velocity Sensitivity Model Experimental Validation.", Measurement Science
and Technology, 14(6), pp. 773-783, 2003
[6] Laser Radar Remote Sensing Vibrometer,
http://sbir.gsfc.nasa.gov/SBIR/successes/ss/4-006text.html
[7] D.
Costley, J. M. Sabatier and N. Xiang, " Forward-looking acoustic mine detection
system", Proc. SPIE 15th Conference on Detection and Remediation
Technologies for Mines and Minelike Targets IV, ed. by Dubey, A.C. et al. 2001,
pp. 617-626
[8] J.W. Goodman, "Laser speckle and related
phenomena" in Topics on Applied Physics, V. 9, Ed. J.C. Dainty,
Springer-Verlag, Berlin, New York 1984
[9] I. Cohen, "On speech enhancement under
signal presence uncertainty", ICASSP-2001, May 2001, pp.167-170
[10] Y. Ephraim, H. Lev-Ari, and W. J. J. Roberts,
"A Brief Survey of Speech Enhancement", the electronic handbook, CRC
Press, (2003).
[11] Y. Hu and P. C. Loizou, "A subspace
approach for enhancing speech corrupted by colored noise", ICASSP-2002,
May 2002, pp.573-576
[12] R. Vetter, "Single channel speech enhancement
using MDL-based subspace approach in bark domain", ICASSP-2002, May 2001,
pp.641-644
[13] K. R. Castleman, Digital Image Processing,
Prentice-Hall, 1979
[14] L. Rabiner and B. Juang, Fundamentals of Speech
Recognition. Englewood Cliffs, New Jersey: Prentice Hall, 1993.
[15] FLIR Systems
Security ThermoVision Cameras. http://www.flir.com/
 The City College of New York